
Demand Analytics
Understanding your clinical trial forecast: patient demand, production planning, inventory, risk assessment, and cost analysis.
Overview
After you set up the trial in the wizard, Prognosis generates comprehensive analytics to help you plan and manage your supply chain. This guide explains each analytics view and how to use the insights for decision-making.
For details on individual tabs, see Supply & Demand Analysis and Analytics Tabs.
Tip: Hover over the information icons throughout the analytics dashboards for detailed explanations of each metric.
Summary Dashboard
The Summary tab provides a high-level overview of your trial's supply requirements.
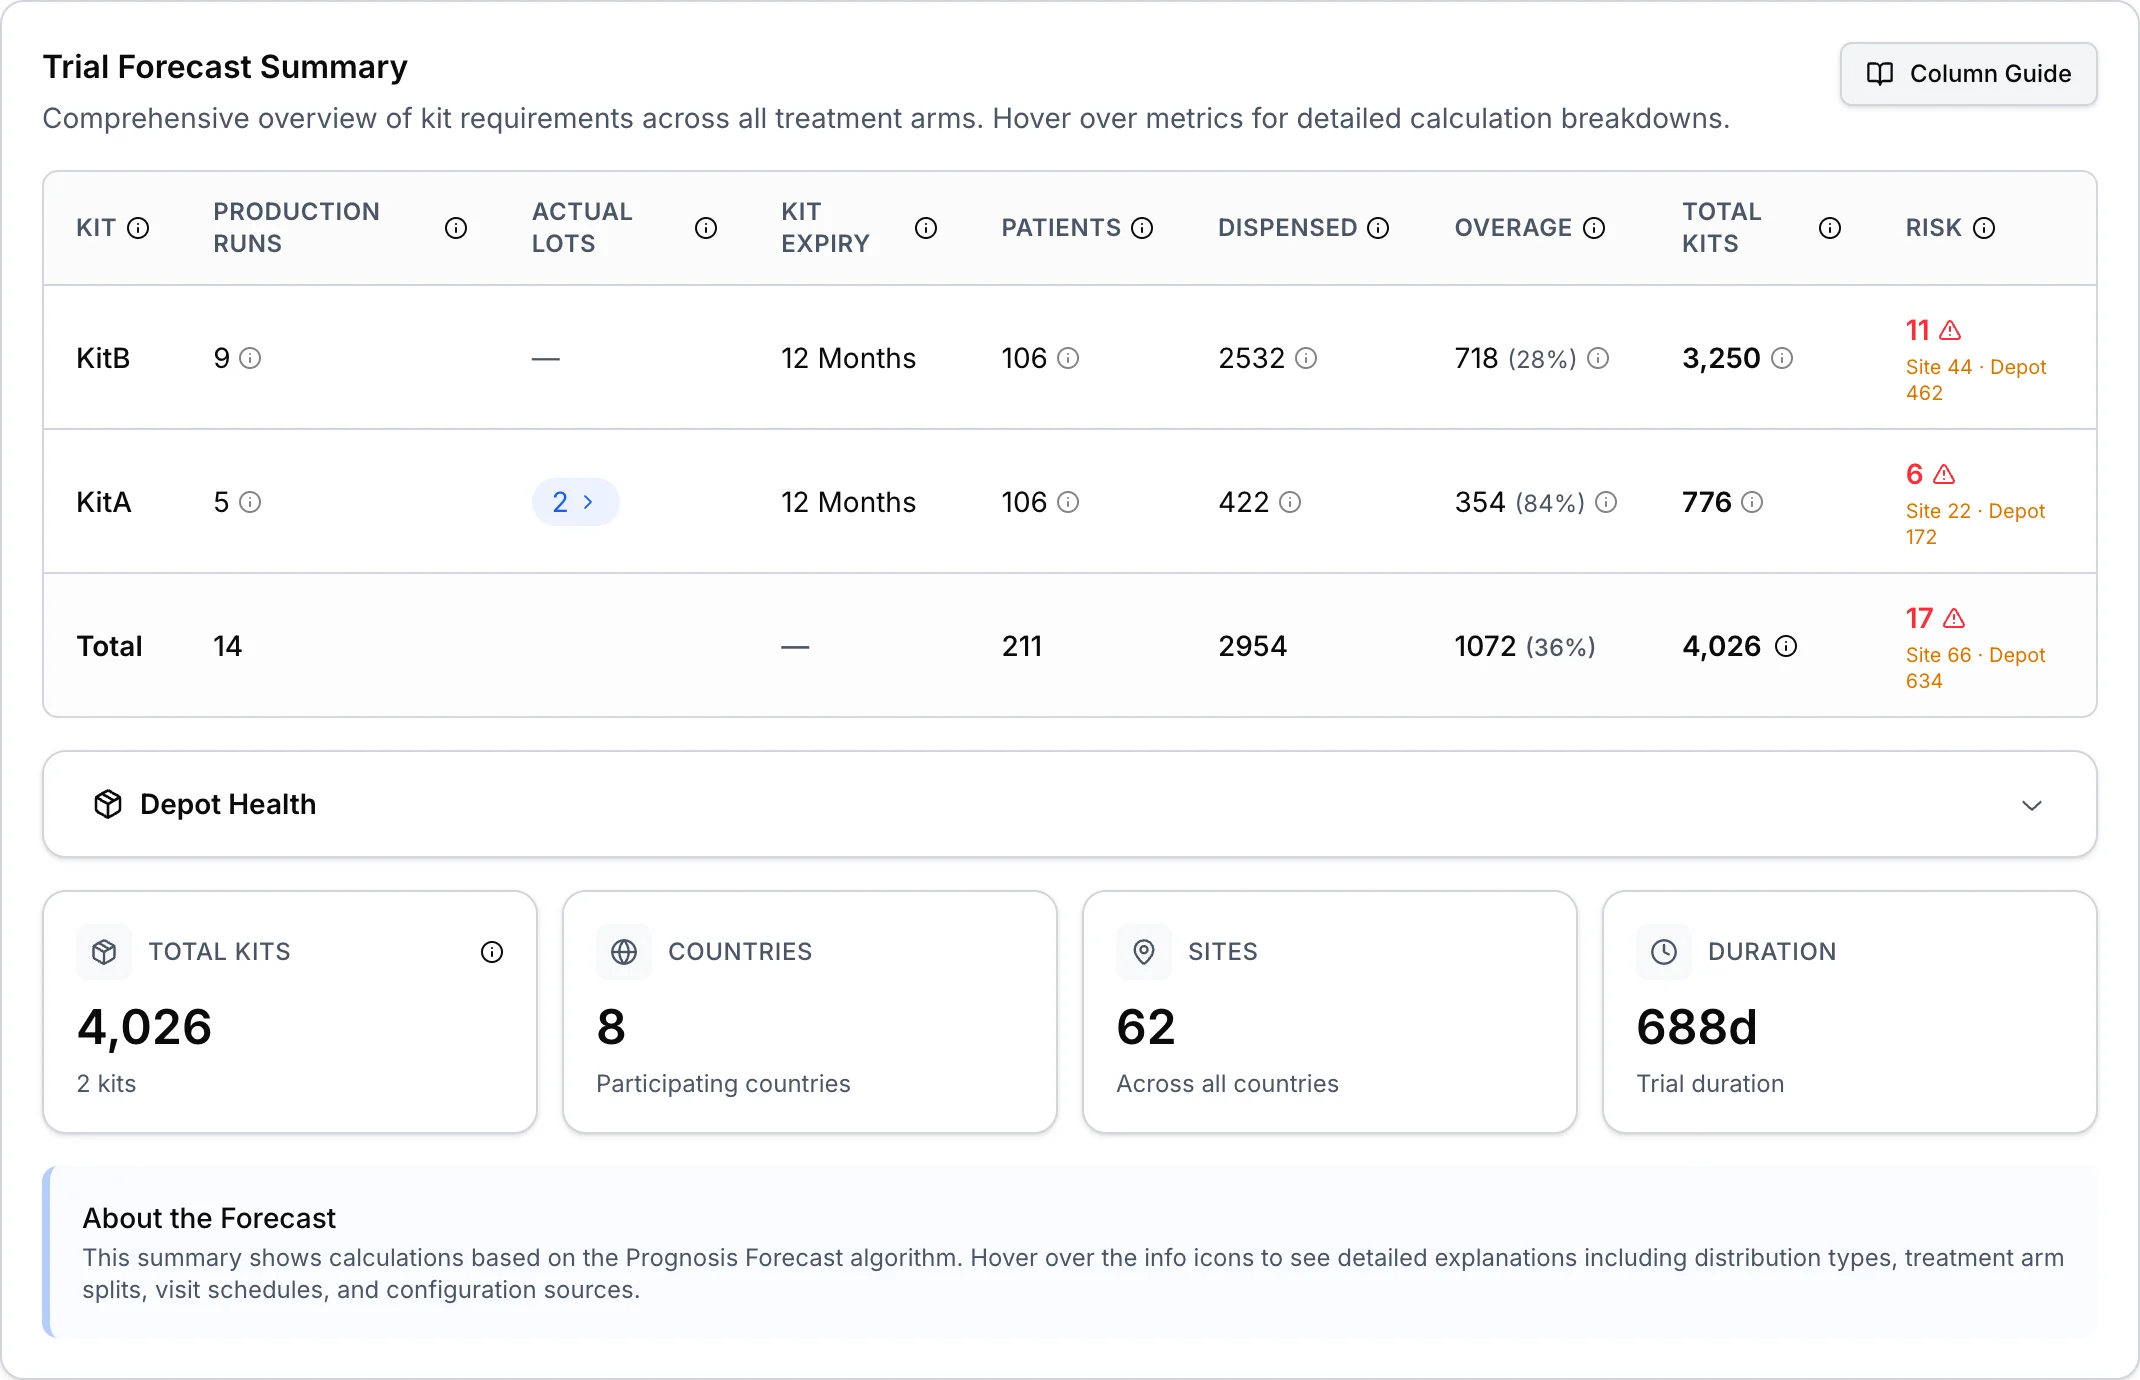
Key Metrics
| Metric | Description |
|---|---|
| Total Kits | Total kits across all kits; hover the info icon to see how it is calculated |
| Countries | Number of participating countries |
| Sites | Number of sites across all countries |
| Duration | Trial duration, from the earliest enrollment start to the last treatment date |
The Summary tab also shows a Depot Health table (stock status per depot) and a per-kit table with columns including Production Runs, Patients, Dispensed, Overage, Total Kits and Risk.
Productions
The Productions tab shows the recommended and custom lots that meet forecasted demand.
Production Schedule
One Production Schedule table lists both recommended lots (badged Recommended lot, or Recommended lot · Pooled for a supply pool's lot) and your custom lots from the Production step (badged Custom lot), with Kit, Label Group, Quantity, Release, Expiry, Lot, Source and Why? columns. Total Productions and Total Quantity sit above it.
Understanding Recommendations
Prognosis calculates production recommendations by:
- Projecting demand -- When will patients need kits?
- Working backwards -- Accounting for shipping and production lead times
- Considering constraints -- Shelf life, depot network, existing inventory
- Optimizing timing -- Balancing production efficiency with supply security
Inventory
The Inventory Timeline chart shows month-end inventory available at configured depots for each kit. The table below it lists every movement (arrivals, consumption, expiry) with a running balance; a negative balance, shown in red, marks a projected stockout.
Sites, Patients and Lead Times
There are no separate Sites, Patients or Lead Times tabs:
- Sites -- The site count is the Sites card on the Summary tab. When Site Shipments is on for the trial, the Site Shipments tab shows supply for individual sites.
- Patients -- Enrollment over time is the Cumulative Patient Enrollment chart on the Graphs tab, monthly patient totals are on Monthly Demand, and the per-kit Patients column is on the Summary tab.
- Lead times -- Lead times are set on the routes in the Country and Depots step. With Depot Shipments, each shipment's Lead time appears in its details.
Risk Assessment
There is no separate Risk tab: the Risk column on the Summary tab, the Risk (Qty) column on Monthly Demand and the Visits & Risk Overview chart on the Graphs tab show potential supply shortfalls. On the Summary tab, click a risk value (or hover it and click View details) for its breakdown: the affected countries, the inventory involved, the risk factors and the calculation details.
Each risk names its cause -- for example, supply that becomes available after the date it is needed, a partial shortfall, a stockout, supply that expires before it can be used, production capped at its maximum quantity, or inventory restricted to other countries by label group. Use the cause to choose the fix: move production earlier, add or enlarge runs, revisit shelf life and production frequency, raise the maximum quantity, or adjust label groups.
Cost Analysis
If you entered costs in the Kits step, the Cost Analysis tab provides financial projections.
Cost Breakdown
Filter by All, Yearly, Quarterly or Monthly. Total Cost and Largest Cost Category summarize the selected period, a chart and table break cost down by category, and Cost by Kit lists each kit's quantity, unit cost and total.
Working with Analytics
Refreshing Forecasts
Analytics automatically update when you:
- Modify trial configuration in the wizard
- Enter new actual enrollment or inventory data
- Change scenario parameters
Exporting Data
Export analytics for offline analysis or sharing:
- Export to Spreadsheet -- Downloads the forecast as an Excel (.xlsx) workbook
Comparing Scenarios
On paid plans, use Smart Comparison to compare forecast results across the trial's linked scenarios. This helps you evaluate the impact of different assumptions on supply requirements.
Next Steps
- How Demand Forecasting Works -- Learn what drives your forecasts and how to improve accuracy
- Scenario Planning -- Create alternative scenarios to test different assumptions
- Managing Drug Substances -- Plan upstream material requirements